Foram encontradas 60 questões.
Disciplina: Inglês (Língua Inglesa)
Banca: CESPE / CEBRASPE
Orgão: Rede SARAH
The diagnosis of malaria includes
Provas
In a urine reagent strip test, the indicators methyl red and bromothymol blue are best used to evaluate the
Provas
In one of the most common staining methods in microbiology, the material is properly prepared and dried on a slide and then fixed with methanol or gentle heat, after which it is stained with crystal violet, Gram iodine, methanol, and safranin. In this procedure, it is expected that
Provas
Choose the option that shows a catalyst frequently used in enzyme immunoassays.
Provas
The particle agglutination immunoassay uses inert particles as labels, as opposed to direct precipitation of the Ag–Ab complexes. Antigens or antibodies attached to particles such as erythrocytes, latex, or metal sol react with the analyte in the specimen. As a result of this immune reaction,
Provas
Text 1A5-II
Below is a description of the procedure for manual leukocyte counting in a laboratory.
I Dilute the blood 1:20 in diluting and lysis fluid and incubate the vial under rotation for 5 minutes for erythrocyte lysis.
II Apply the fluid containing cells to the counting chamber, just enough to fill the space beneath the cover glass.
III Allow the cells to settle for 5 minutes and verify uniform cell distribution under the microscope.
IV Count the leukocytes using the condenser diaphragm of the microscope partially closed and a 10x objective lens. The leukocytes are counted in each of the four large (1 mm2) corner squares (A, B, C, and D shown in the figure below). A total of eight large corner squares from two sides of a chamber are counted.
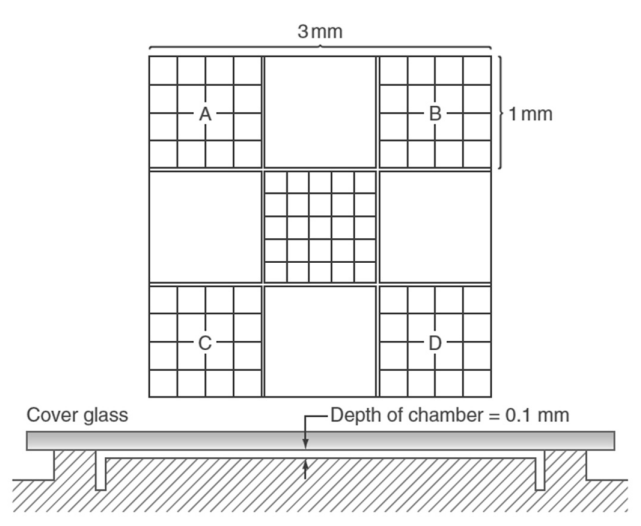
Each large square encloses a volume of 1/10 mm3, and a general formula is as follows.
Leukocyte count (cells/mm3) = (cc/lsc) × d ×10, where cc is the total number of cells counted, d is the dilution factor, 10 is the factor transforming value over one large square (1/10 mm3) to the volume in mm3 , and lsc is the number of large squares counted.
Suppose that a given blood sample, prepared according to the procedure described in text 1A5-II, yielded 300 cells as the total number of cells counted in the eight squares of a chamber. In this case, the number of cells/L in the blood tested was
Provas
Text 1A5-II
Below is a description of the procedure for manual leukocyte counting in a laboratory.
I Dilute the blood 1:20 in diluting and lysis fluid and incubate the vial under rotation for 5 minutes for erythrocyte lysis.
II Apply the fluid containing cells to the counting chamber, just enough to fill the space beneath the cover glass.
III Allow the cells to settle for 5 minutes and verify uniform cell distribution under the microscope.
IV Count the leukocytes using the condenser diaphragm of the microscope partially closed and a 10x objective lens. The leukocytes are counted in each of the four large (1 mm2) corner squares (A, B, C, and D shown in the figure below). A total of eight large corner squares from two sides of a chamber are counted.
Each large square encloses a volume of 1/10 mm3, and a general formula is as follows.
Leukocyte count (cells/mm3) = (cc/lsc) × d ×10, where cc is the total number of cells counted, d is the dilution factor, 10 is the factor transforming value over one large square (1/10 mm3) to the volume in mm3 , and lsc is the number of large squares counted.
The sample preparation procedure shown in text 1A5-II
Provas
Text 1A5-I
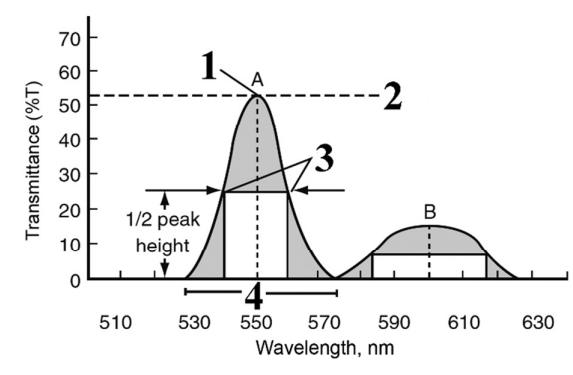
A critical component of spectrophotometers is the device used to select the appropriate wavelength. Several types of wavelength selectors are available, including filters, prisms, grating monochromators, and holographic gratings. The quality of these selectors is described by their nominal wavelengths, spectral bandwidths, and bandpass. Nominal wavelength represents the wavelength in nanometers at peak transmittance. Spectral bandwidth is the range of wavelengths above one-half peak transmittance. It is sometimes called the half power point or full width at half peak maximum (FWHM). The total range of wavelengths transmitted is the bandpass.
The figure below summarizes these characteristics of wavelength selectors and shows the difference in wavelength selectivity between interference and absorbance filters. The numbers 1, 2, 3 and 4 represent, respectively, (1) the wavelength of 550 nm, (2) the transmittance of 52%, (3) the range of wavelengths represented by the side of the rectangle indicated and (4) the range of wavelengths between 530 and 577 nm, as shown in the figure. The letters A and B represent the effect of two different filters, obtained in different experiments.
As metabolically complex cells, hepatocytes contain high levels of a number of enzymes. With liver injury, these enzymes may leak into plasma and can be useful for diagnosis and monitoring of liver injury.
Based on the passage above, it is correct to affirm that the enzyme that participates in amino acid metabolism, has isoenzymes in both the cytosol and mitochondria of hepatocytes, and is used as a serum indicator of liver injury is called
Provas
Text 1A5-I
A critical component of spectrophotometers is the device used to select the appropriate wavelength. Several types of wavelength selectors are available, including filters, prisms, grating monochromators, and holographic gratings. The quality of these selectors is described by their nominal wavelengths, spectral bandwidths, and bandpass. Nominal wavelength represents the wavelength in nanometers at peak transmittance. Spectral bandwidth is the range of wavelengths above one-half peak transmittance. It is sometimes called the half power point or full width at half peak maximum (FWHM). The total range of wavelengths transmitted is the bandpass.
The figure below summarizes these characteristics of wavelength selectors and shows the difference in wavelength selectivity between interference and absorbance filters. The numbers 1, 2, 3 and 4 represent, respectively, (1) the wavelength of 550 nm, (2) the transmittance of 52%, (3) the range of wavelengths represented by the side of the rectangle indicated and (4) the range of wavelengths between 530 and 577 nm, as shown in the figure. The letters A and B represent the effect of two different filters, obtained in different experiments.
Considering the previous graph and text 1A5-I, choose the correct option regarding the differences between peaks A and B.
Provas
Text 1A5-I
A critical component of spectrophotometers is the device used to select the appropriate wavelength. Several types of wavelength selectors are available, including filters, prisms, grating monochromators, and holographic gratings. The quality of these selectors is described by their nominal wavelengths, spectral bandwidths, and bandpass. Nominal wavelength represents the wavelength in nanometers at peak transmittance. Spectral bandwidth is the range of wavelengths above one-half peak transmittance. It is sometimes called the half power point or full width at half peak maximum (FWHM). The total range of wavelengths transmitted is the bandpass.
The figure below summarizes these characteristics of wavelength selectors and shows the difference in wavelength selectivity between interference and absorbance filters. The numbers 1, 2, 3 and 4 represent, respectively, (1) the wavelength of 550 nm, (2) the transmittance of 52%, (3) the range of wavelengths represented by the side of the rectangle indicated and (4) the range of wavelengths between 530 and 577 nm, as shown in the figure. The letters A and B represent the effect of two different filters, obtained in different experiments.
Based on the figure above and on text 1A5-I, the characteristics indicated by 1, 2, 3 and 4 are, respectively,
Provas
Caderno Container