Graph 1: Total suspected, probable, and confirmed cases of Ebola virus disease in Guinea, Liberia, and Sierra Leone, March 25, 2014 – August 23, 2015, by date of WHO Situation Report, n=28005
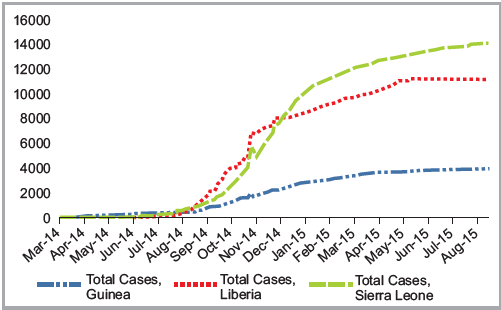
(Disponível em http://www.cdc.gov/vhf/ebola/outbreaks/2014-west-africa/cumulative-casesgraphs. html Acessado em 28/08/205)
Olhando o gráfico acima você diria que ele