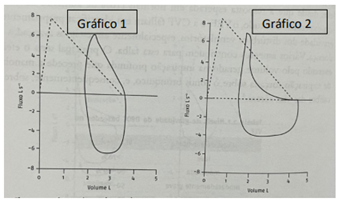
Observe os gráficos a seguir.
PELLEGRINO R. et al. ATS/ERS task force: standardization of lung function testing – interpretative strategies for lung testes. European Respiratory Journal. 2005; 26: 948-968.
Os valores espirométricos foram:
Gráfico 1: VEF1 = 66%; VEF1/CV = 80%; PFE = 79%; CPT = 62%.
Gráfico 2: VEF1 = 64%; VEF1/CV= 64%; PFE = 82%; CPT = 72%.
Os distúrbios ventilatórios representados nos gráficos são, respectivamente,